Ichimoku Cloud (or Ichimoku Kinko Hyo) identify the direction and the inversion of the market trend. This is not its only purpose … so let’s have a look at some strategies using this indicator and settings on IQ Option application.
Ichimoku Cloud, also known as Ichimoku Kinko Hyo, is a technical analysis tool that belongs to the category of indicators. In other words, it mainly serves to identify the direction and the inversion of the market trend. This, however, is not its only purpose. Being rather versatile, Ichimoku can also be used as an oscillator. That is, it is able to measure the speed of the price change of a given asset. Furthermore, it can identify support and resistance levels.
Let’s start by watching some Ichimoku Cloud strategies (English only)
An in-depth look at the Ichimoku Cloud purpose and strategy
To better illustrate what the Ichimoku Cloud consists of, we will break it down into separate elements. There are a total of five elements, each of which is a moving average.
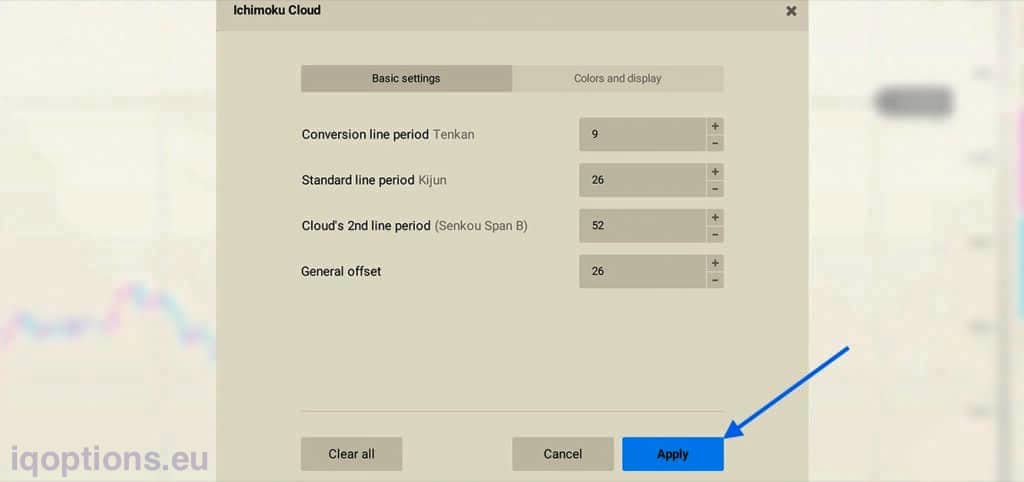
The Tenkan conversion line and the standard Kijun line are also called balance lines. The conversion line (blue) creates an average of the maximum and minimum levels of the last 9 periods. It can signal the inversion of the trend when it crosses the standard line (red). The standard line, to create a comparison, creates an average of the maximum and minimum levels of the last 26 periods. It serves as a level of dynamic support and resistance.
The second pair of moving media Senkou Span A and Senkou Span B forms the so-called cloud (cloud). First, Senkou Span A generates the average of the two equilibrium lines and shifts the values derived forward by 26 periods. Secondly, Senkou Span B generates the average of the maximum and minimum levels of the last 52 periods, projecting the results forward to 26 periods.
Fra Senkou Span A and Senkou Span B form a shadow zone on the chart. This is the cloud, which changes colour from red to green and vice versa whenever the two ends cross each other. When the cloud turns green, the market is bullish. On the contrary, when the colour changes to red, the market is considered bearish. The cloud changes colour when the trend seems destined to undergo an inversion. The vertical distance between the limits of the cloud serves as an indicator of market volatility.
Finally, the Chikou Span line (green line) represents the closing price of the current candle, moved forward by 26 periods. This next moving average (lagging) helps confirm the trend.
How to set it up?
Ichimoku Cloud settings on IQ Option application
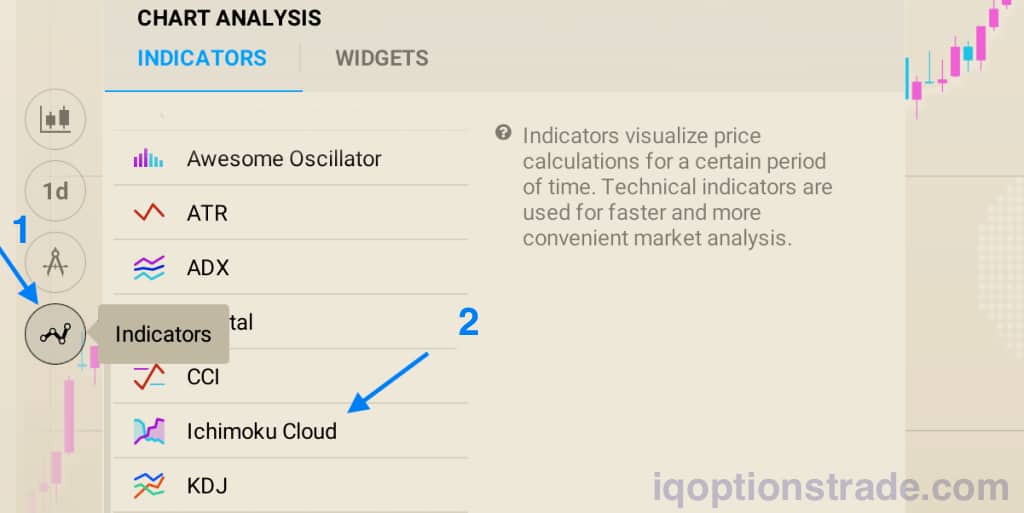
To add the Ichimoku Cloud to the selected asset just follow these simple steps: First, open the Indicators icon and, in the pop-up menu, scroll to find Ichimoku Cloud. Once clicked on the indicator, a settings menu will open.
Leave the preset parameters (or adjust them as needed) and click Apply.
Done! You can change the settings for the Ichimoku Cloud later, or you can remove the indicator from the graph by returning to the icon Indicators.

Summary
In conclusion, the Ichimoku Cloud suggests an uptrend when the candles are above the cloud. When the cloud changes from red to green, candles move above the Kijun baseline and the Tenkan conversion line moves past the baseline, the indicator is signalling that the market may reverse downwards.
In contrast, the Ichimoku Cloud suggests a bearish trend when candles are below the cloud. When the cloud changes from green to red, candles move below the Kijun baseline and the Tenkan conversion line moves below the baseline, the indicator is signalling that the market may reverse upward. Professional traders prefer to combine Ichimoku Cloud with other indicators for a more precise analysis.
If it turns out that the trend is not very visible it is better not to trade with the trend. It is better to use indicators such as the RSI or Stochastic Oscillator. If the market is stagnant it is better to draw a price corridor and speculate in a calm market.
Source: IQOption blog
Read more on Ichimoku Cloud:
https://www.investopedia.com/terms/i/ichimoku-cloud.asp



 How to trade CFD? (00:49)
 How to trade binary options*? (01:22)
 Forex. How to start? (01:01)