Average Directional Index (ADX) – the indicator used to measure the strength of a trend and trend direction. Examples and videos.
What is the Average Directional Index (ADX)?
The Average Directional Index (ADX) is a technical analysis tool used to measure the strength of a trend. The plus directional indicator (+ DI) and the minus direction indicator (-DI) accompany the ADX line, highlighting the trend direction. Used together they form a trading system capable to determine both the direction and the strength of the trend.
ADX is used to identify strong trends and potentially profitable entry and exit points. This indicator was developed and introduced to the public by Welles Wilder, a guru of technical analysis of the twentieth century.
Pros and cons of ADX indicator.
Pros of the ADX indicator:
- Simple graphical presentation
- Clear interpretation
- Clear messages and signals
- Few parameters to configure
Minuses of the ADX indicator:
- Generates weaker quality signals on lower intervals (for testing)
- Excludes from trading when sideways trends are present
- Before use, it is necessary to adjust the parameters of the indicator
ADX as shown on the IQ Option trading platform

The logic behind the indicator
How strong is the current trend?
This is the question that ADX is perfectly able to answer. The indicator was created with the sole purpose of quantifying the strength of a trend.
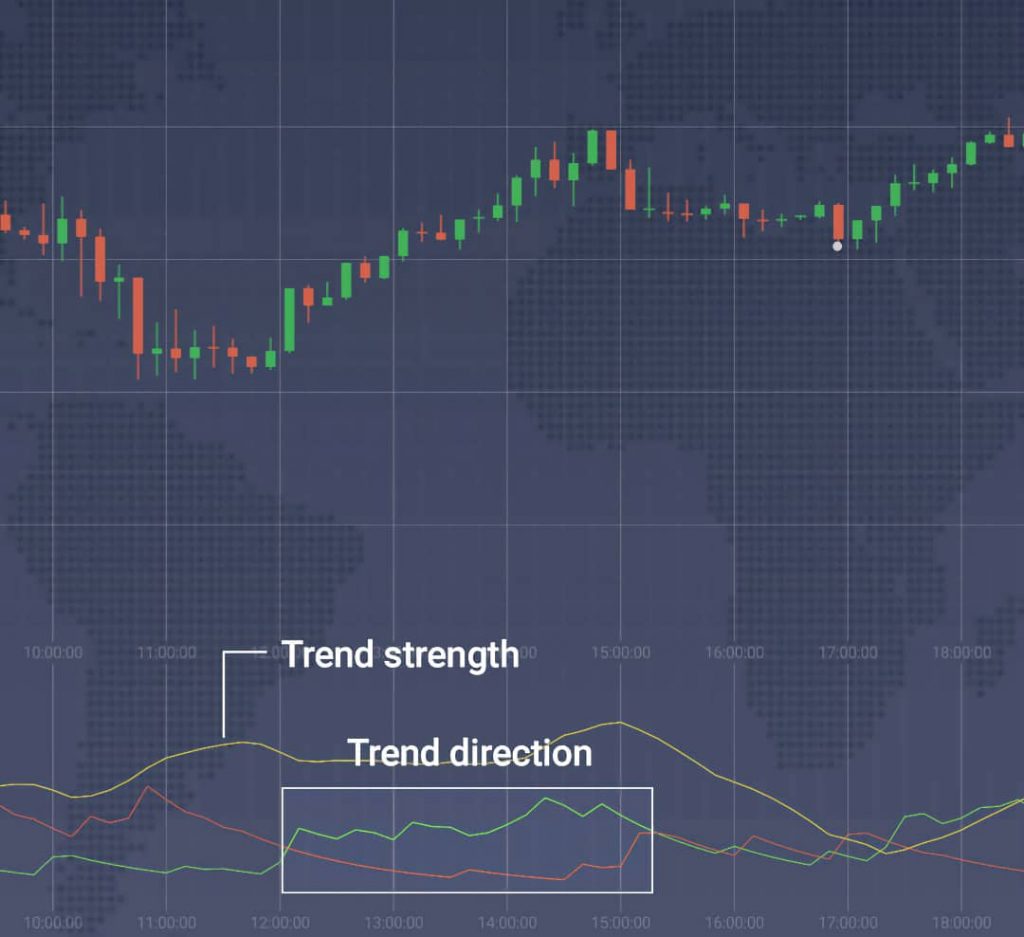
The moving average of the price range expansion serves as a basis for ADX. The indicator consists of three lines: ADX itself (yellow line), a + DI line (green line), and a -DI line (red line). + Measure the strength of the positive trend, while -D measures the intensity of the negative movement. The ADX line shows the general strength of the trend by collecting both the bullish and bearish tendencies.
The index consists of three main lines

When + DI is above -DI, it is said that the bulls have the directional advantage. In contrast, when -DI is higher than + DI, the directional advantage belongs to the bears.
It is important to understand that ADX (yellow line) only shows the strength of the trend and not the direction of the trend. The trend direction can instead be determined by observing + DI and -DI (red and green lines).
The ADX line shows the strength of the trend, the lines + DI and -DI show the direction of the trend

How to set it up?
Setting the Average Directional Index on the IQ Option platform is easy.
Click on the “Indicators” button in the lower left corner of the screen. Then choose ADX from the list of available indicators.
1. Indicator setting.

Open the “Set & Apply” tab and click on the “Apply” button if you want to use the indicator with the standard parameters. Otherwise, the latter can be adjusted to your liking. Note that increasing the period reduces the sensitivity of ADX and at the same time increases the accuracy of the indicator.
2. Indicator setting.

ADX is ready to be used.
How to use ADX in trading?
Trading with the trend reduces risks and increases profit potential. As a result, many traders prefer to control the strength of the trend with the help of ADX before investing their money. There are two main ways to use the indicator:
1. Crossover DI
When the positive and negative directional lines intersect, it usually means that the trend is reversing. This information can be used to determine optimal entry points. For investors using this trading system the signals are as follows:
- Enter the market (buy options on) when + DI is above -DI and the general trend is bullish.
Bullish crossover + DI and -DI

- Leave the market (buy options down) when + DI is below -DI and the general trend is bearish.
Bearish crossover + DI e-DI

2. Force of the Tendency
In trading, not only in the direction of the trend counting. The strength of the trend is also important, as it defines the amount of profit that a Forex trader might be able to get from an operation. There are also situations (eg using the “strangle” trading strategy) in which the direction of the trend is not important until the volatility of the market is not high enough.
The ADX ranges between 0 and 100, where 0 equates to an absolutely flat market and 100 to an extremely powerful trend.
| ADX value | Force of Tendency |
| 0-25 | Absent or Weak Tendency |
| 25-50 | Strong Trend |
| 50-75 | Very strong trend |
| 75-100 | Extremely strong tendency |
In this case, ADX can be combined with other indicators that show the direction of the future price action movement.
Sometimes is good to see how other traders use trading indicators:
Conclusions
The Average Directional Index is a truly unique technical analysis indicator that, combined with other indicators, can become an excellent trading tool in the hands of a trader. Used in conjunction with the + DI and -DI lines (as suggested on the IQ Option platform) it is not only able to predict the strength of the trend, but also its direction.
But like any other indicator, it should be used with caution and you should always double-check on different time intervals. The ADX may be lagging behind the current trend and therefore provide outdated information.
Source: IQOption blog


 How to trade CFD? (00:49)
 How to trade binary options*? (01:22)
 Forex. How to start? (01:01)