
This educational material is courtesy of IQoption broker. Find out more here.
General Risk Warning: The financial services provided by this website carry a high level of risk and can result in the loss of all your funds. You should never invest money that you cannot afford to lose
Trend Lines (Support, and Resistance) help identify the trend direction and the reversal points. There are three types of trends: “bullish” (price rise), “bearish” (price fall), and “sideways” (price without change).
Moving Average Video:
Why do we need it?
- Defines the direction of future price movements.
- Determines the strength of the trend.
- Defines the entry points.
How to use?
- Drawing the support line. The support line is a level from which the price will usually rise. Choose the“horizontal line” and draw this level on the chart.
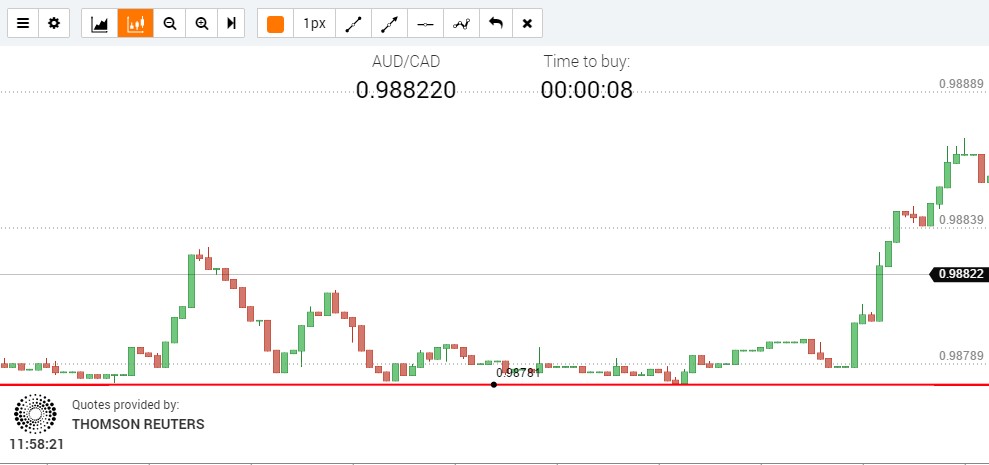
- Drawing the resistance line. The resistance line is a level from which the price will usually fall. Choose the “horizontal line” and draw this level on the chart.
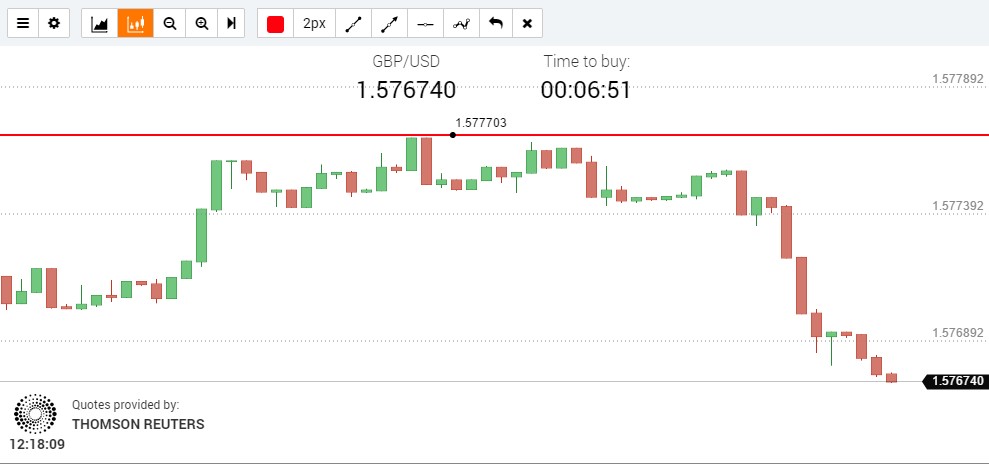
Breaking support/resistance lines strategy
Breaking a level – a simple trading strategy which talks about catching the price movement at the moment while it breaks support or resistance level. In this strategy we are going to look at two options of level breaking – “Breaking the support/resistance lines” and “Breaking the trend lines”.
Breaking support resistance lines:
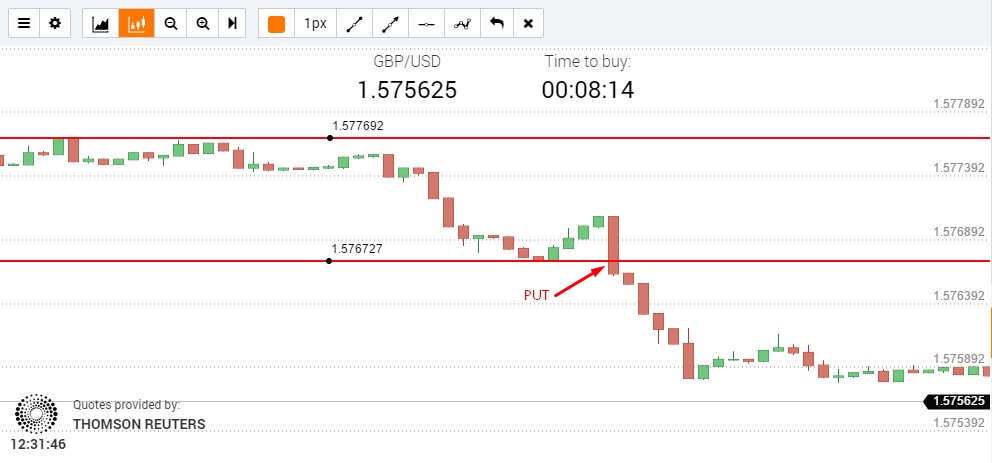
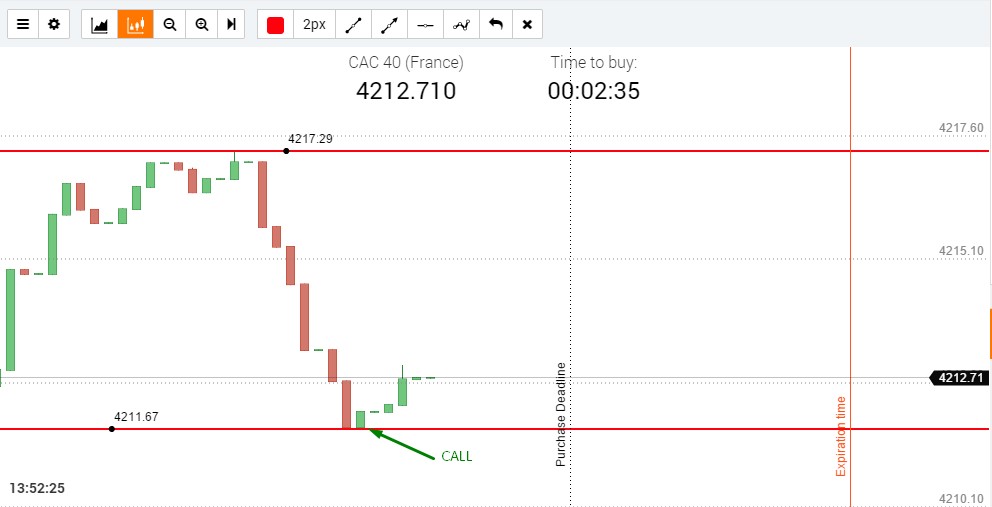
- If the closing candle is above the resistance level, this increases the possibility of a quick price rally — buy call option.
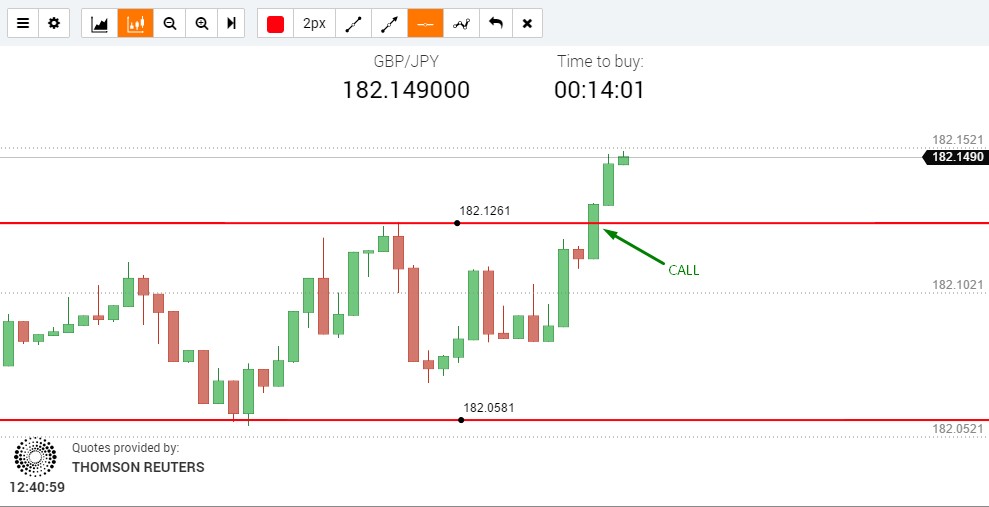
- If the closing candle is below the support line, this increases the possibility of a quick price fall – buy put option.
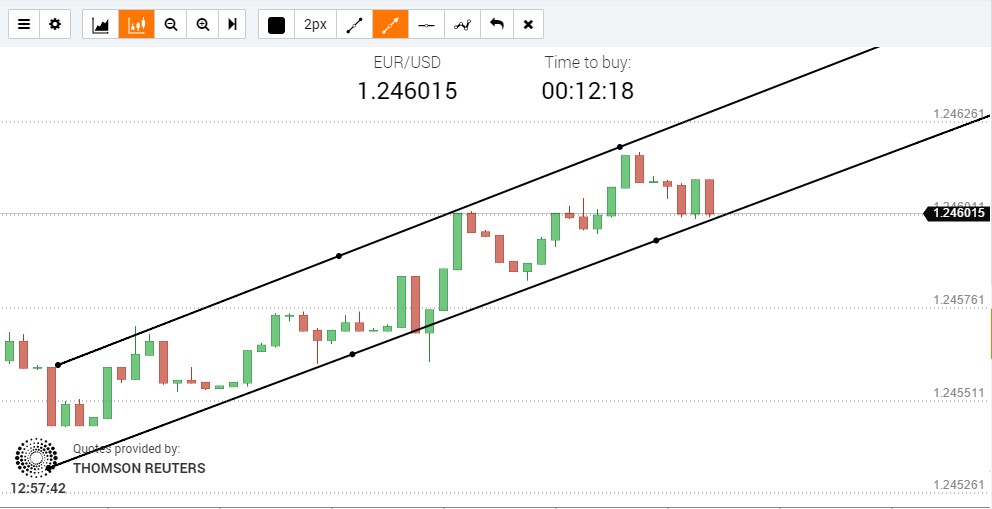
Breaking trend line:
The trend line is a corridor formed by support and resistance lines. The asset price fluctuates within this corridor.
Trend lines:
- Drawing the trend line: Define the price corridor, within which the price either rises or falls. Choose the“Trend line” instrument and draw the corridor on the chart.
- If the closing candle is below the support line, this increases the possibility of a quick price fall – buy put option.

- If the closing candle is above the resistance level, this increases the possibility of a quick price rise – buy/call option.3

Rebound from support/resistance strategy
A rebound from the level is a trading strategy aimed at catching the price at the moment when it cannot break the support or resistance level.
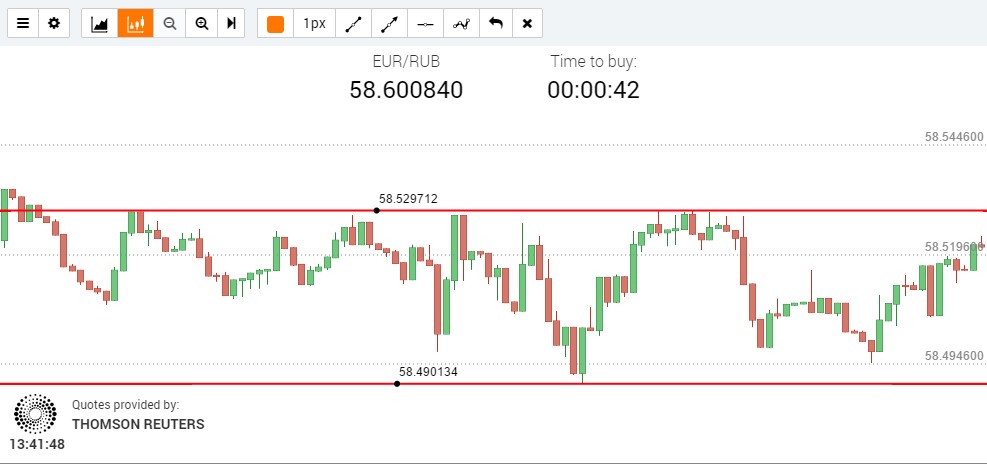
A rebound from the support/resistance level:
- Drawing the price corridor::
- Define the level, from which the price always rebounds up; choose the “horizontal line” instrument and draw this level on the chart.
- Define the level, from which the price always rebounds down; choose the “horizontal line” , instrument and draw this level on the chart
- If the price reaches the resistance level, and the first candle closes below this level, this indicates that the rebound possibility exceeds the growth possibility -buy put option.
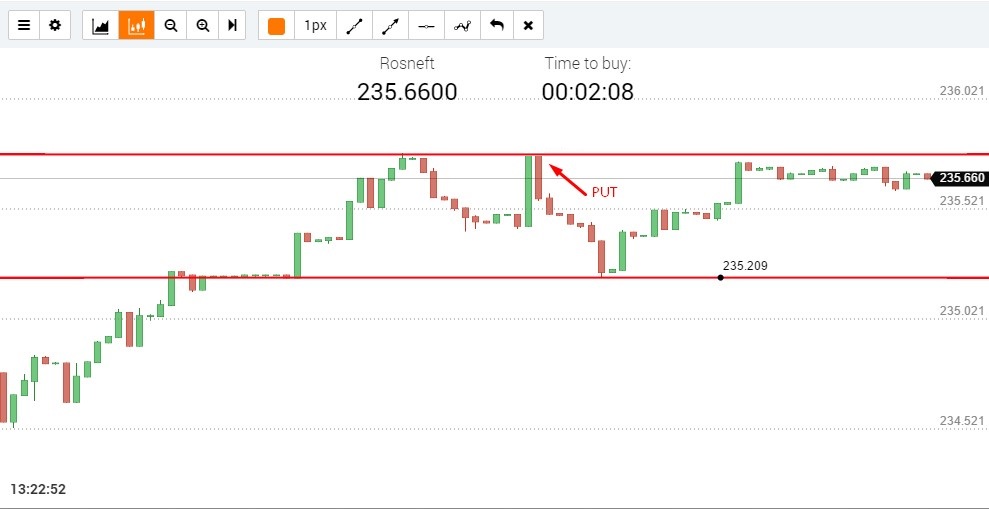
- If the price reaches the support level, and the first candle closes above this level, this indicates that the rebound possibility exceeds the growth possibility – buy call option.
Advanced usage
The trend lines, like support and resistance can be applied to the chart only as they are approximate and drawn by you. In the price terms, this is an area, where thousands of market players place their buy and sell orders. Not all market players set the same price for the buy or sell orders that is why the price will not clearly rebound from your trend lines. They are drawn only on your screen.
On analyzing the break and rebound points, you shall understand that the signals can turn out false. For more accurate signals, we recommend you to use the support and resistance lines, as well as other indicators..
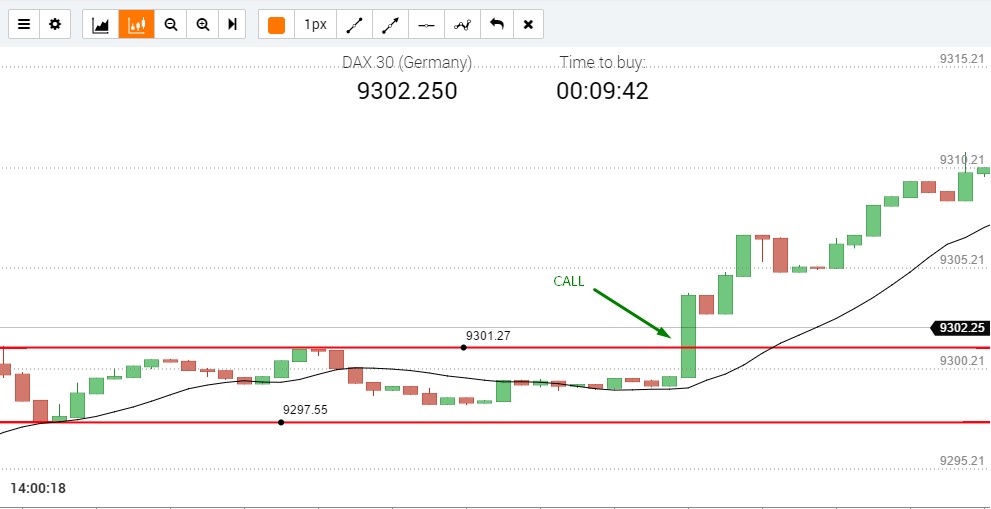
Resistance, Support, and the SMA:
- Signal 1 — breaking the resistance level.
- Signal 2 — the Moving Average indicates a clear uptrend.
- Buy call option
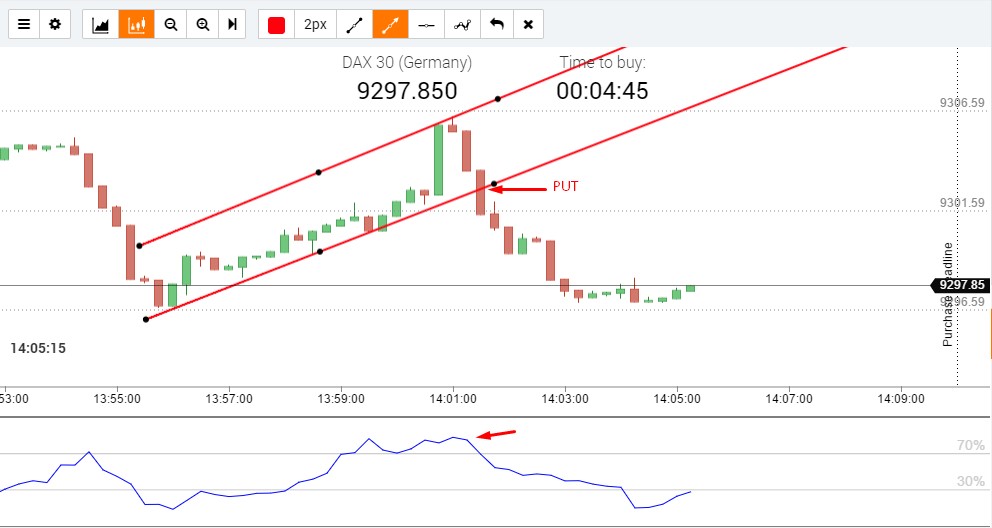
Resistance, Support, and the RSI::
- Signal 1 — breaching the support level.
- Signal 2 — the RSI is above 70%.
- Buy put option
This educational material is courtesy of IQoption broker. Find out more here.
General Risk Warning: The financial services provided by this website carry a high level of risk and can result in the loss of all your funds. You should never invest money that you cannot afford to lose