This educational material is courtesy of IQoption Broker. Find out more here.
General Risk Warning: The financial services provided by this website carry a high level of risk and can result in the loss of all your funds. You should never invest money that you cannot afford to lose
Video Guide:
Binary Trading with Bollinger’s Band
Bollinger Bands – Bollinger Bands is a very popular technical indicator which defines a “normal” price range movement for every particular asset. When the price is out of the normal range it could be a signal for buying an option.
Why do we need it?
- Define the entry points.
How to use it?
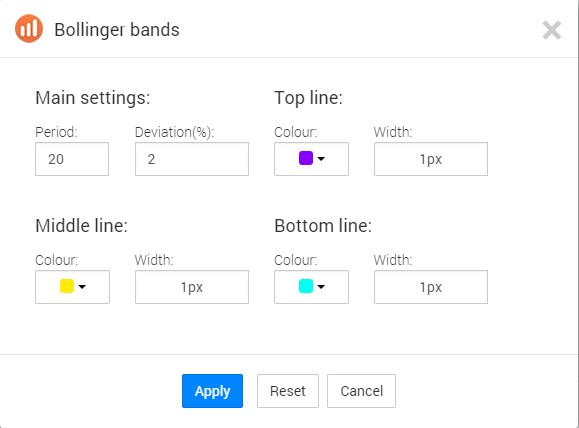
- Choose the “Bollinger Bands” from the indicators list.

- Without changing the settings, click “Apply”
How does it work?
The Bollinger Bands represent 3 lines on the price chart, which may narrow or widen depending on the price volatility in the market. When the market is quiet, the Bollinger Bands are narrowing, but when there are abnormal price spikes, the Bollinger Bands expand their borders.
The central line is a simple moving average which is a standard period of 20 bars. Two other lines are the average lines with a certain number of standard deviations.
Bollinger Bands Strategy
“Bollinger Bands” is a trading strategy aimed at defining the trend reversal and the price pullback to the average price level.
Simple layout:
- Apply the Bollinger Bands indicator to the graph.
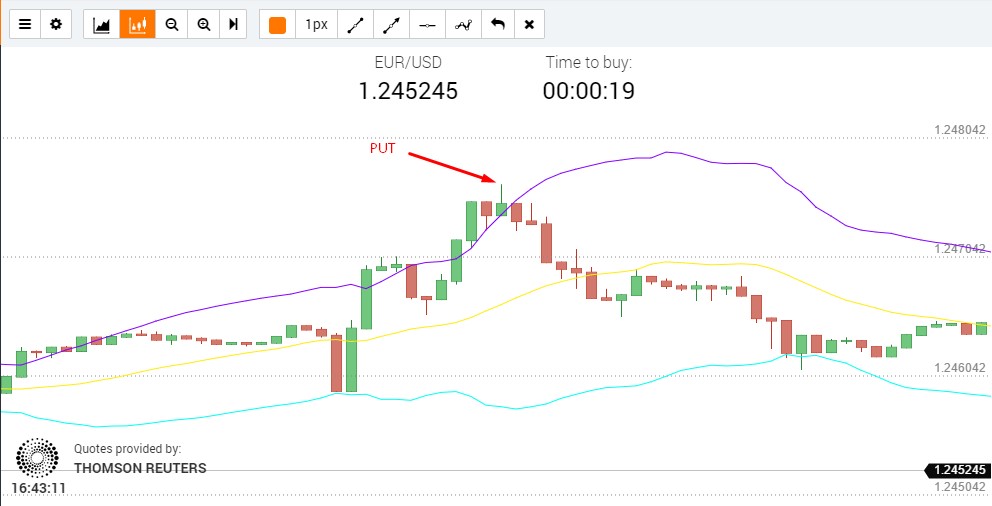
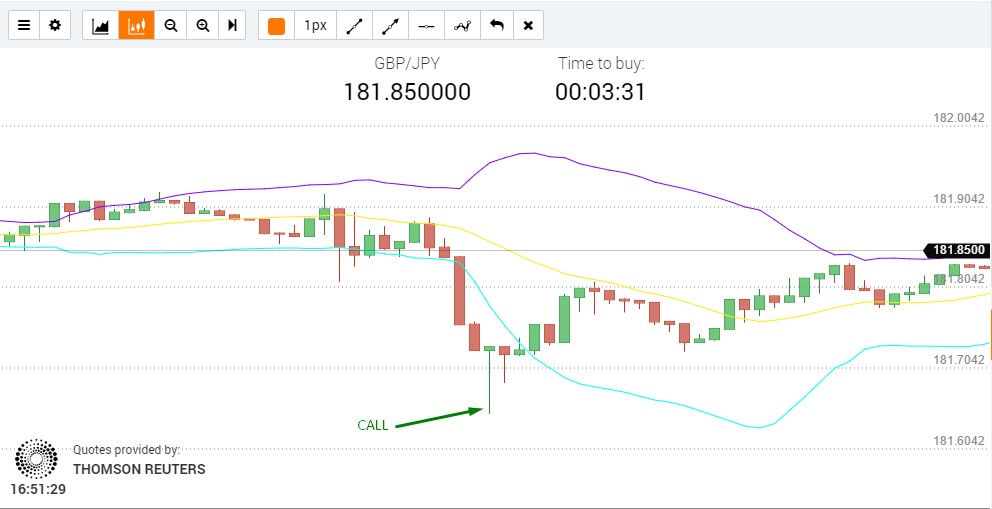
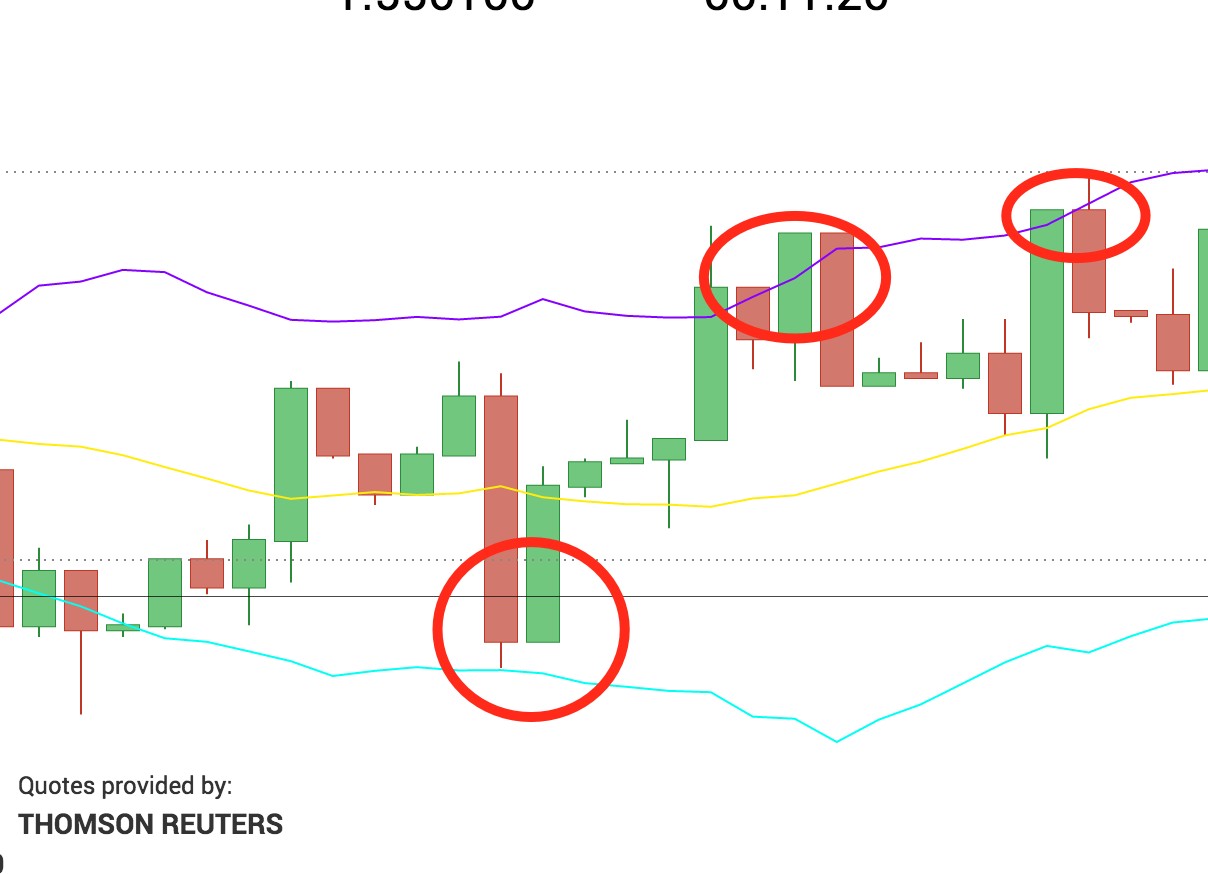
- Wait until the candle breaches above/below the upper or the lower Bollinger Band:
- If the candle closes above the upper Bollinger band this will signal that the price will soon sink and return to its average – buy the put option.
- If the candle closes below the lower Bollinger Band, this will signal that the price will soon move up and return to its average – buy the call option.
Advanced usage
The indicator is perfect for a sideways move (flat market). When the trend is strong, the price can move along the indicator border, yet in the end, it will move back to its average. When the market moves sideways, the price often changes its dynamics. It does not stop at the average level, but rather continues to move to the opposite border. After touching the border, the price begins its way up.
Narrowing the borders indicates a calm market, but after narrow consolidation, the price always makes a sharp move. Very often, the indicator fails to react quickly, while the price breaches the borders and moves far beyond. Such moments are pretty dangerous for trading. The price will certainly move back to the average level, but the risks in such transactions are much higher.
Despite the apparent simplicity of the indicator, the Bollinger Bands is a powerful instrument which can achieve excellent results. Please note that practical experience and a keen eye are extremely important when using technical indicators. These skills distinguish successful from novice traders. It should be also noted that the Bollinger Bands is not an all-purpose instrument and cannot be 100% correct.
Bollinger bands – Accurate signal
This strategy is designed to increase the Bollinger bands signals accuracy.
In order to increase the accuracy, we will support the signals provided by the regular Bollinger bands indicator by candlestick patterns.
Simple layout:
- Apply the “Bollinger bands” indicator to the graph.
- Wait for the moment when current candlestick (signal) breaks the upper or the lower Bollinger band above or below.
- Wait for the next candlestick to close after the signal:
– If the candlestick closes in the same direction as the signal one (growing at uptrend, falling at downtrend), this signal should be ignored.
– If the candlestick closed in the reverse direction, an option should to be bought.
– Call option is bought at the bounce off the lower Bollinger band.
– Put option is bought at the bounce off the higher Bollinger band.
Advanced usage
In this strategy, you can also use the shape of Japanese candlesticks to define reversal more clearly.
Linkage of the “Piercing Line” strategy, together with the bounce off the lower Bollinger band, will give a more accurate signal to trend reversal up and to buy a call option.
Linkage of the”Three black crows” strategy, together with a bounce off the higher bound, will give a more accurate signal to trend reversal down and to sell a put option.
This educational material is courtesy of IQoption. Find out more here.
General Risk Warning: The financial services provided by this website carry a high level of risk and can result in the loss of all your funds. You should never invest money that you cannot afford to lose